Visualizing WizTelemetry Tracing Data with Tempo
This section describes how to use Grafana Tempo for WizTelemetry (referred to as Tempo) to visualize the distributed tracing data from WizTelemetry Tracing in the Grafana console, i.e., to visualize the complete flow of a user request through the distributed system.
Prerequisites
A Grafana console has been deployed via the Grafana for WizTelemetry extension.
Steps
-
Install the Grafana Tempo for WizTelemetry extension into the cluster.
-
Enter the cluster where Tempo is installed. On the Application Workloads > Services page, find the service
tempo-distributor, click its name to enter the details page. Click Operations > Edit External Access, enable NodePort. Then, on this page, obtain the NodePort corresponding to service port4317.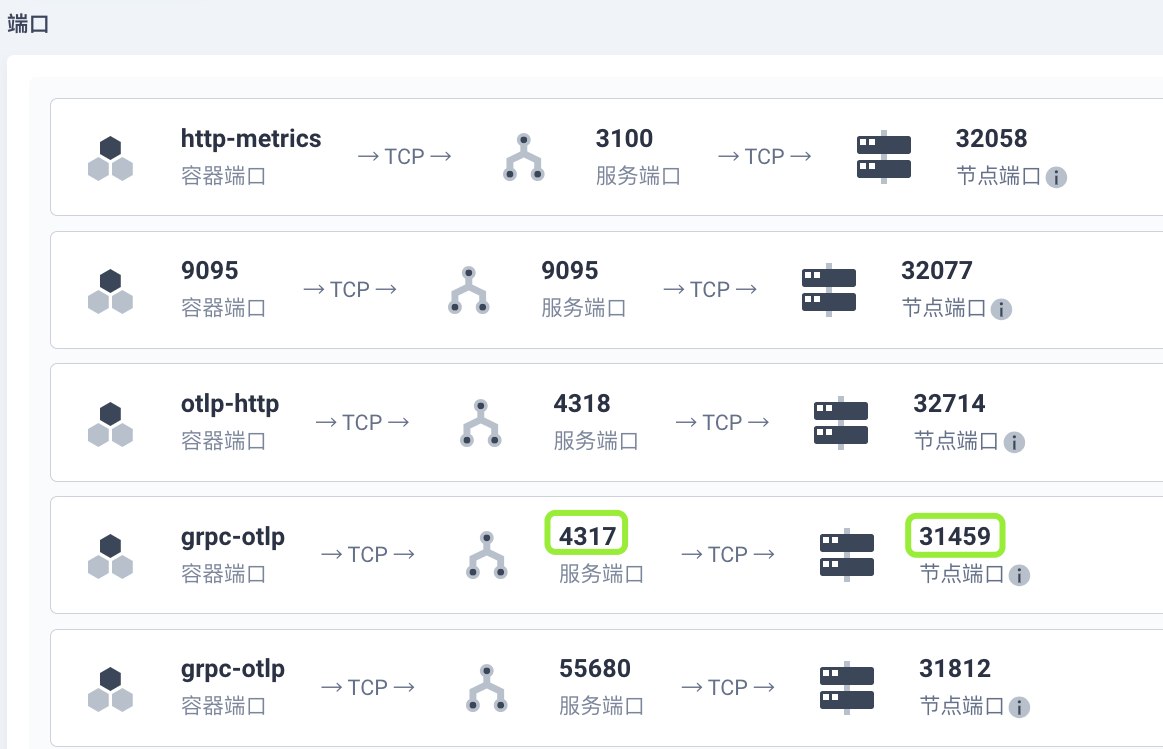
Note Depending on your network environment, you may need to configure traffic forwarding rules and allow this NodePort port in the firewall.
-
Install the WizTelemetry Tracing extension, and modify the extension configuration to send trace data to Tempo.
collector:
  collector:
    config: |
      exporters:
        otlp:
          # tempo-distributor.wiz-telemetry-tracing:4317
          endpoint: < tempo distributor grpc endpoint >
          headers:
            x-scope-orgid: wiztelemetry-tracing-ks
          tls:
            insecure: true
      service:
        pipelines:
          traces:
            exporters:
              - otlp
              - otlphttp
Note: Replace
< tempo distributor grpc endpoint >with<cluster-node-ip>:<grpc nodeport>. For example, based on the NodePort obtained in the previous step, it should be modified to<cluster-node-ip>:31459. -
Configure the Tempo data source in the Grafana console.
If the Tempo and Grafana for WizTelemetry extensions are deployed in the same cluster, after Tempo installation is complete, the Tempo data source will be automatically added to the Grafana console.
If the Tempo and Grafana for WizTelemetry extensions are deployed in different clusters, you need to expose the service via NodePort or LoadBalancer
tempo-query-frontendto obtain the server address for the Tempo data source, and then manually add the Tempo data source in the Grafana console. Detailed steps are as follows:-
Expose the
tempo-query-frontendserviceThe following uses the NodePort method to expose the
tempo-query-frontendservice.-
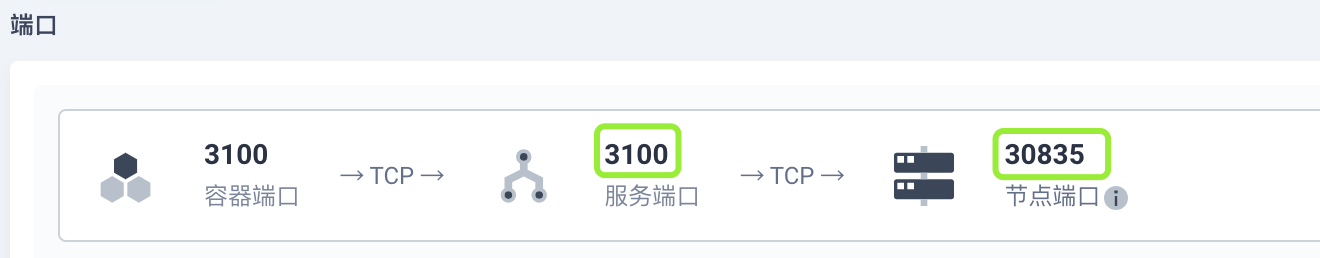
Enter the cluster where Tempo is installed. On the Application Workloads > Services page, find the service
tempo-query-frontend, click its name to enter the details page. -
Click Operations > Edit External Access, enable NodePort. Then, on this page, obtain the NodePort corresponding to service port
3100.
-
-
Manually add the Tempo data source
-
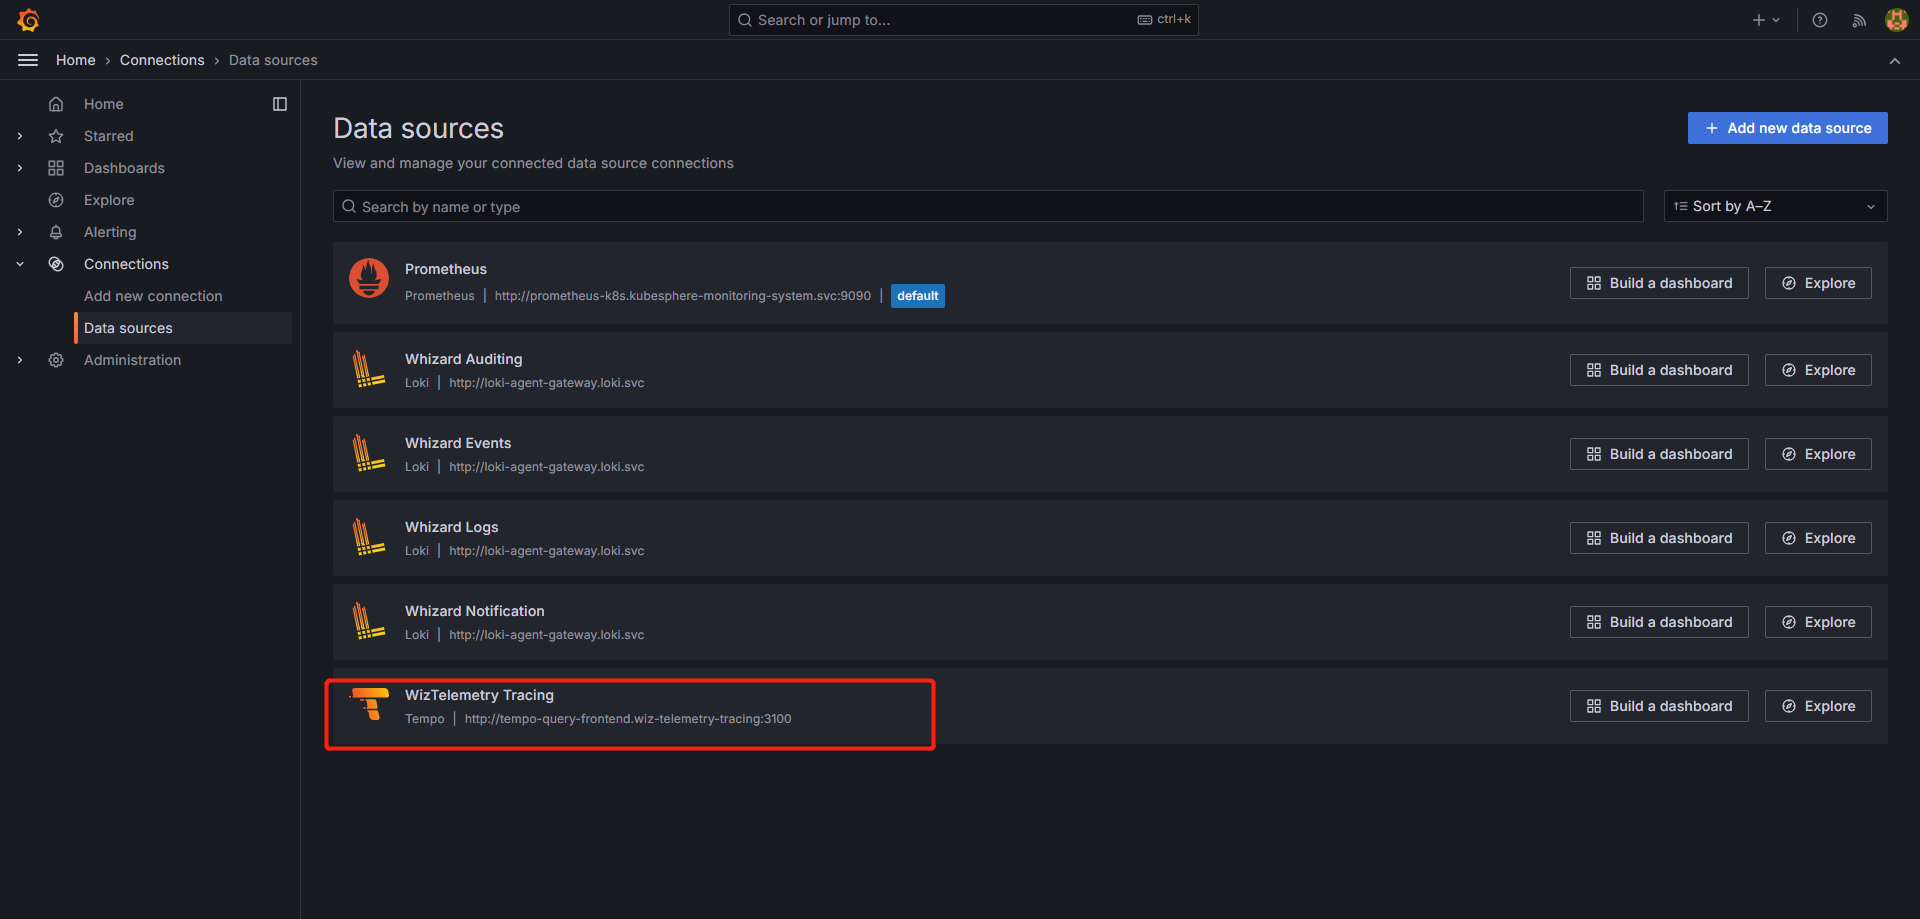
After logging into the Grafana console, click Connections in the left navigation pane.
-
Search for a data source, such as Tempo.
-
Click the data source name to enter the data source overview page.
-
Click Add new data source in the upper right corner to enter the data source configuration page.
-
Enter the server address for the Tempo data source:
<cluster-node-ip>:<tempo-query-frontend-nodeport>. For example, based on the NodePort obtained in the previous step, you should enter<cluster-node-ip>:30835.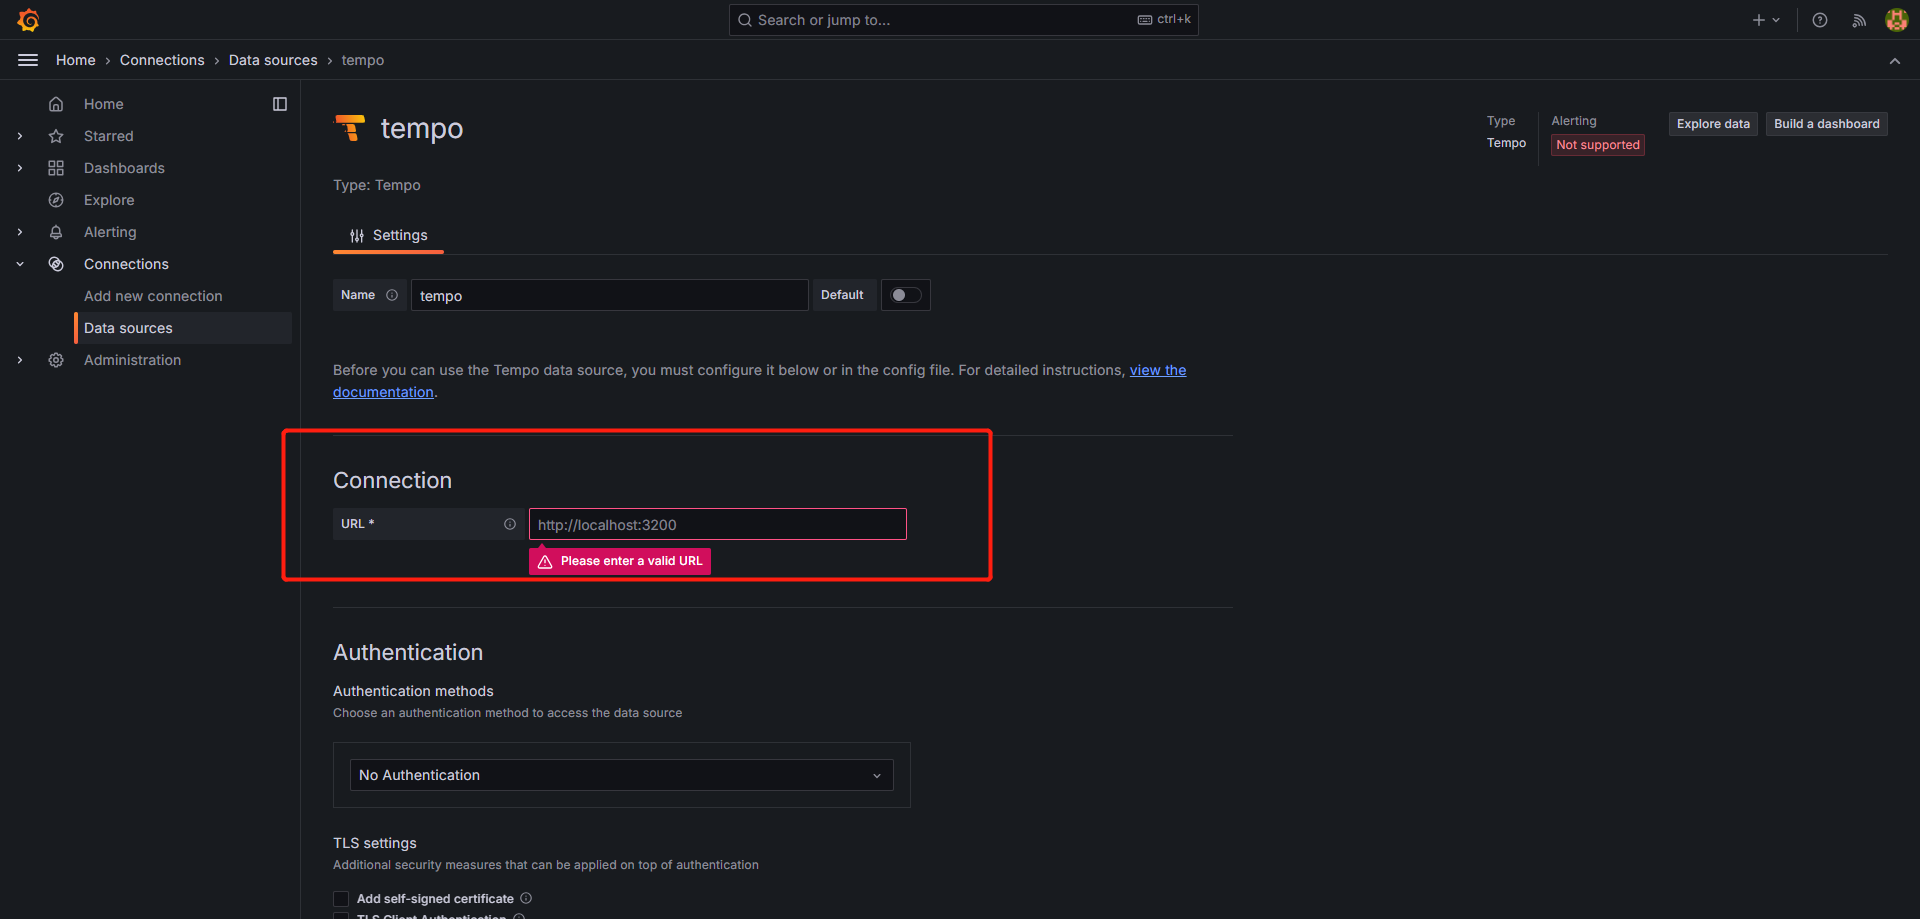
-
Add a header.
x-scope-orgid: wiztelemetry-tracing-ks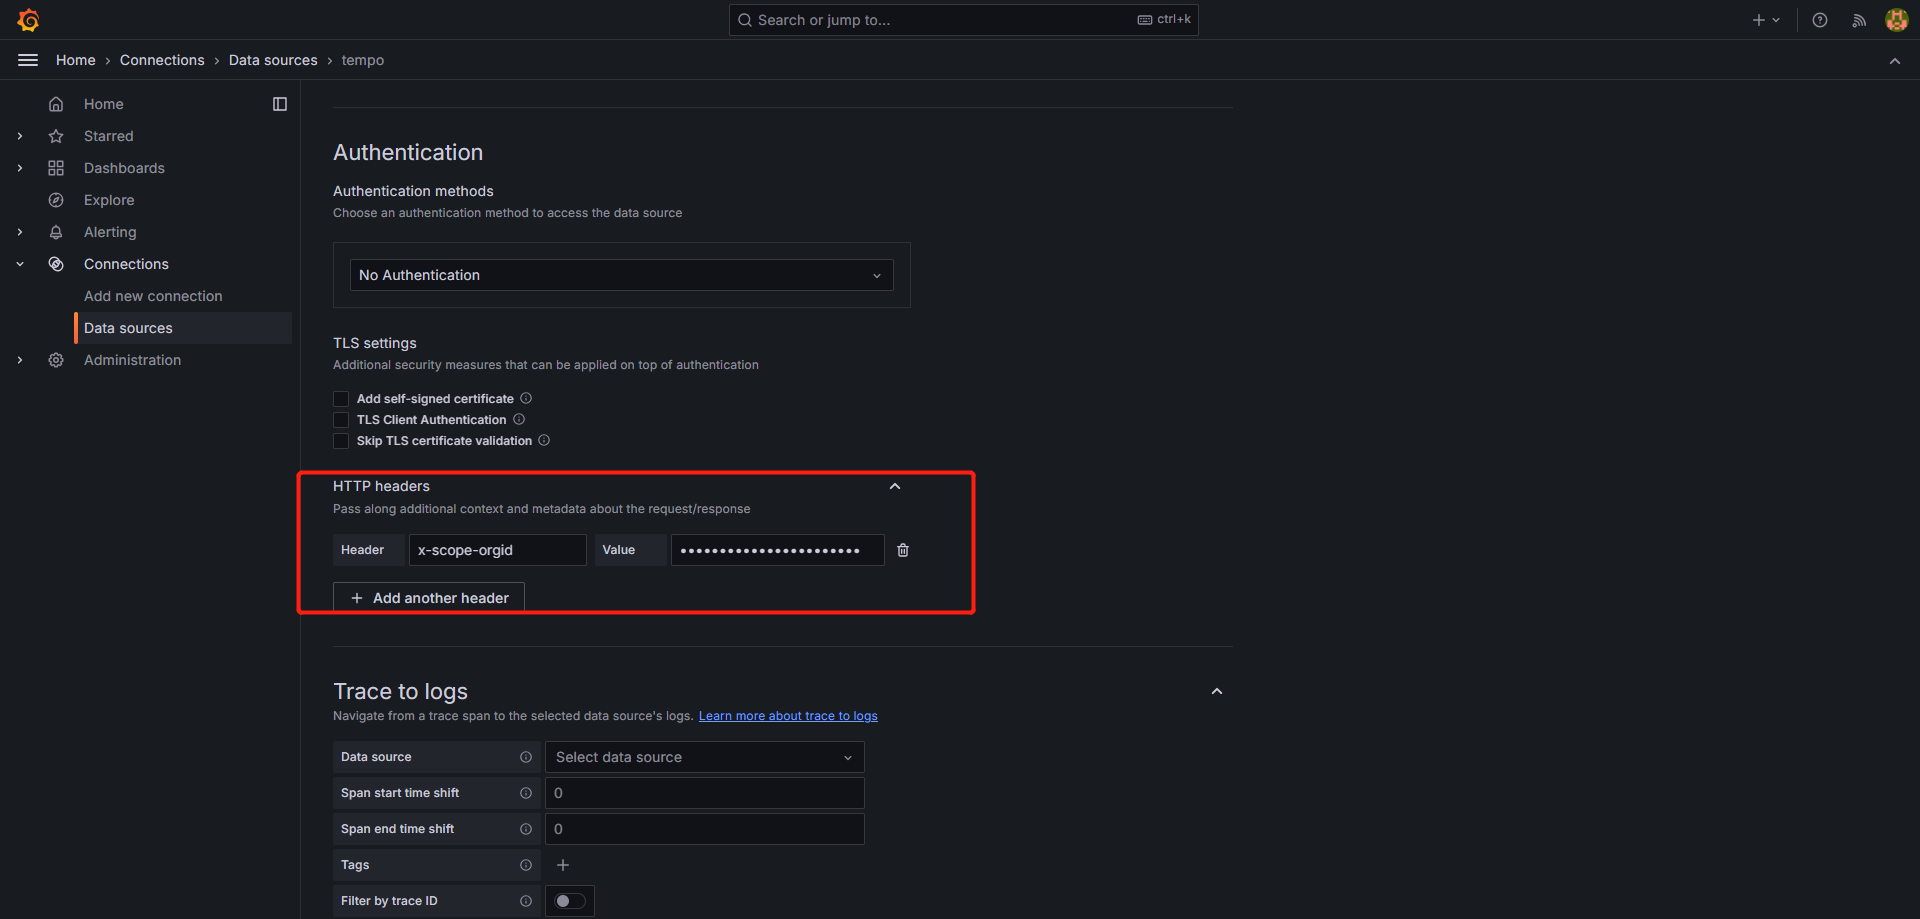
-
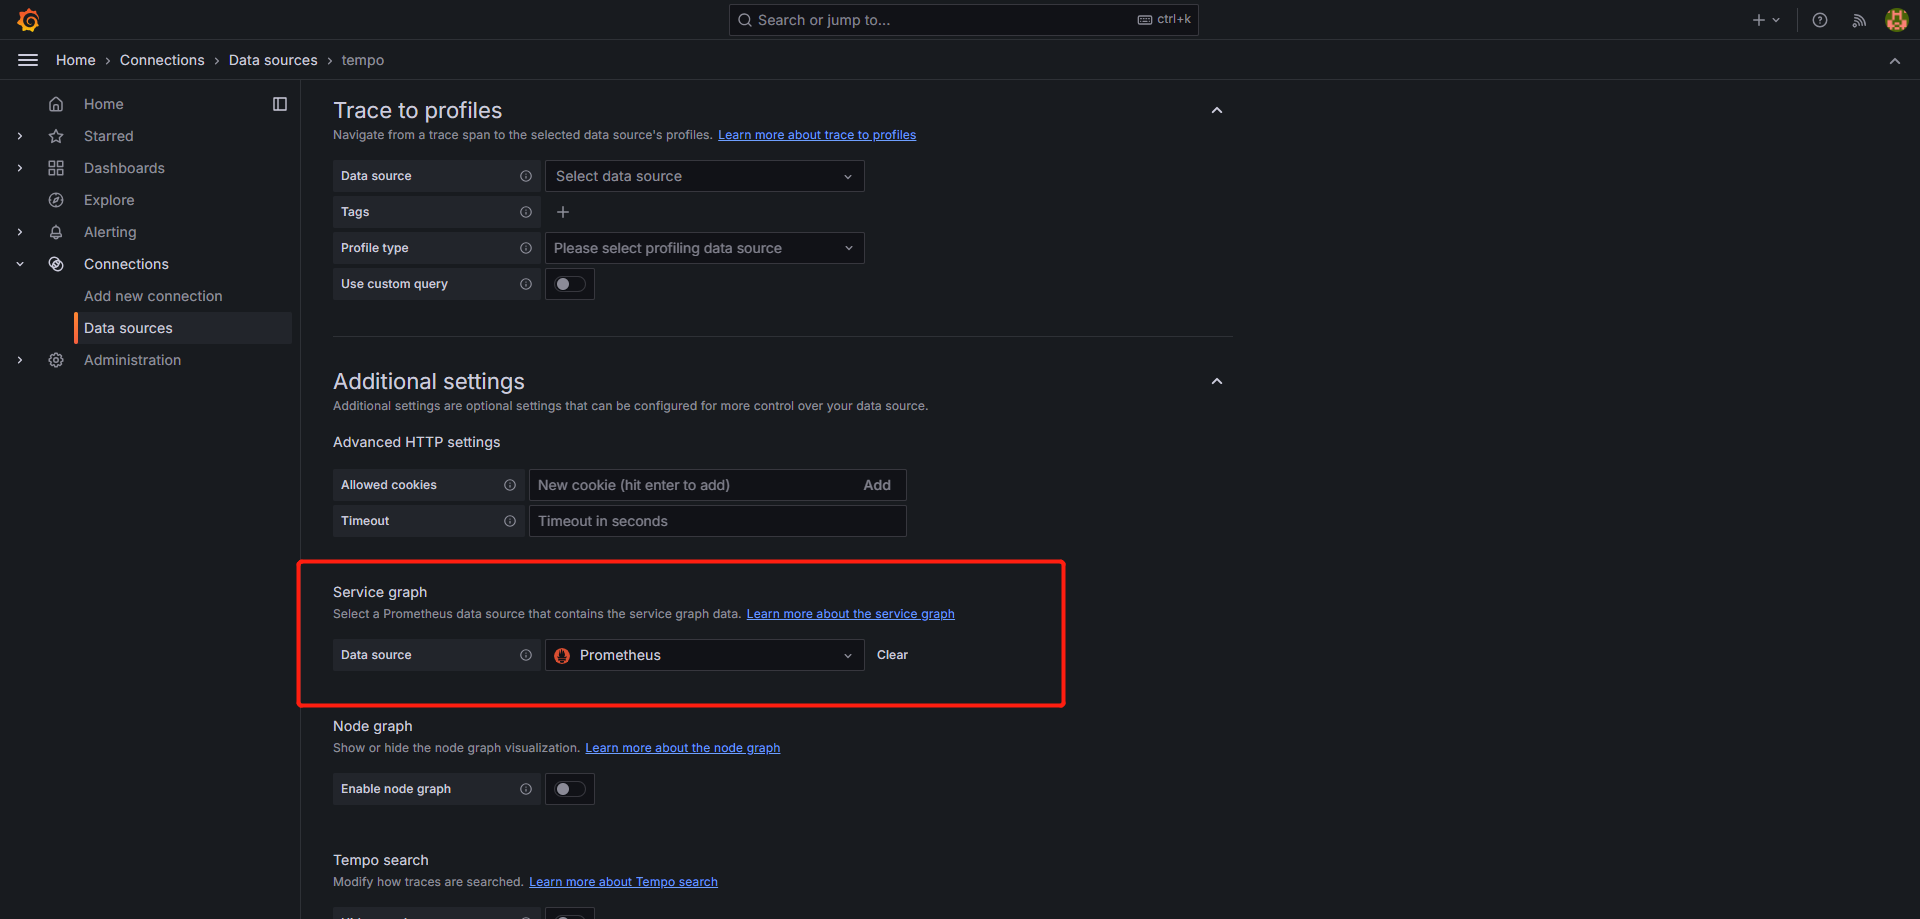
Set the Prometheus data source for Service graph.
-
Click Save & test at the bottom to complete adding the data source.
-
-
-
In the Grafana console, click Explore in the left navigation pane to enter the page, and select the Tempo data source.
-
Click the TraceQL tab, then click the
 in the upper right corner to run the query and list the latest trace data. Click one of them to view the trace graph.
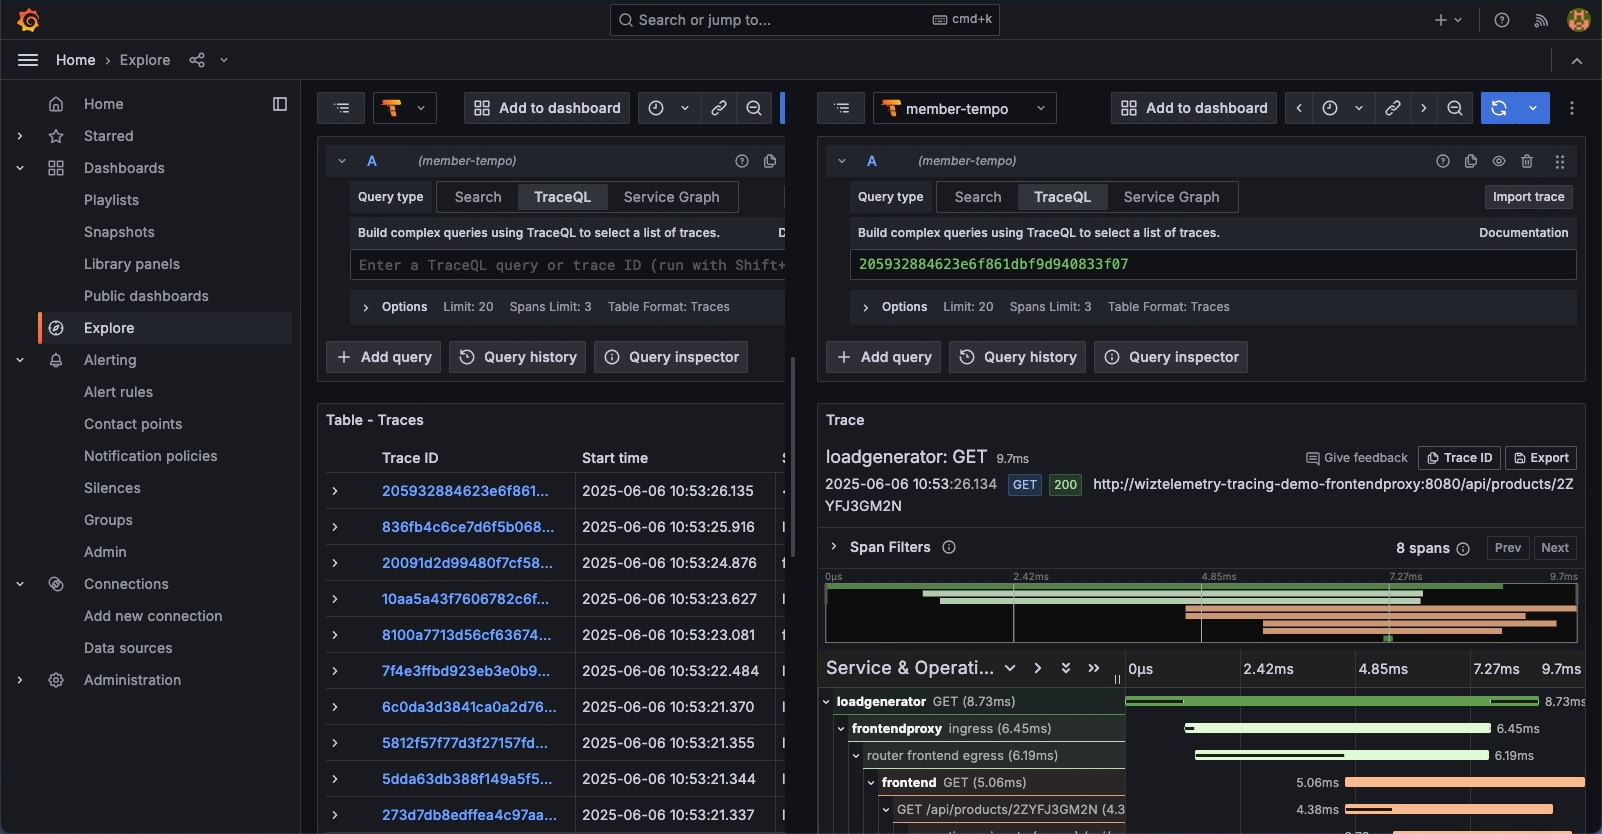
-
Click the Service Graph tab, then click the
in the upper right corner to run the query and view the service topology graph generated by Tempo.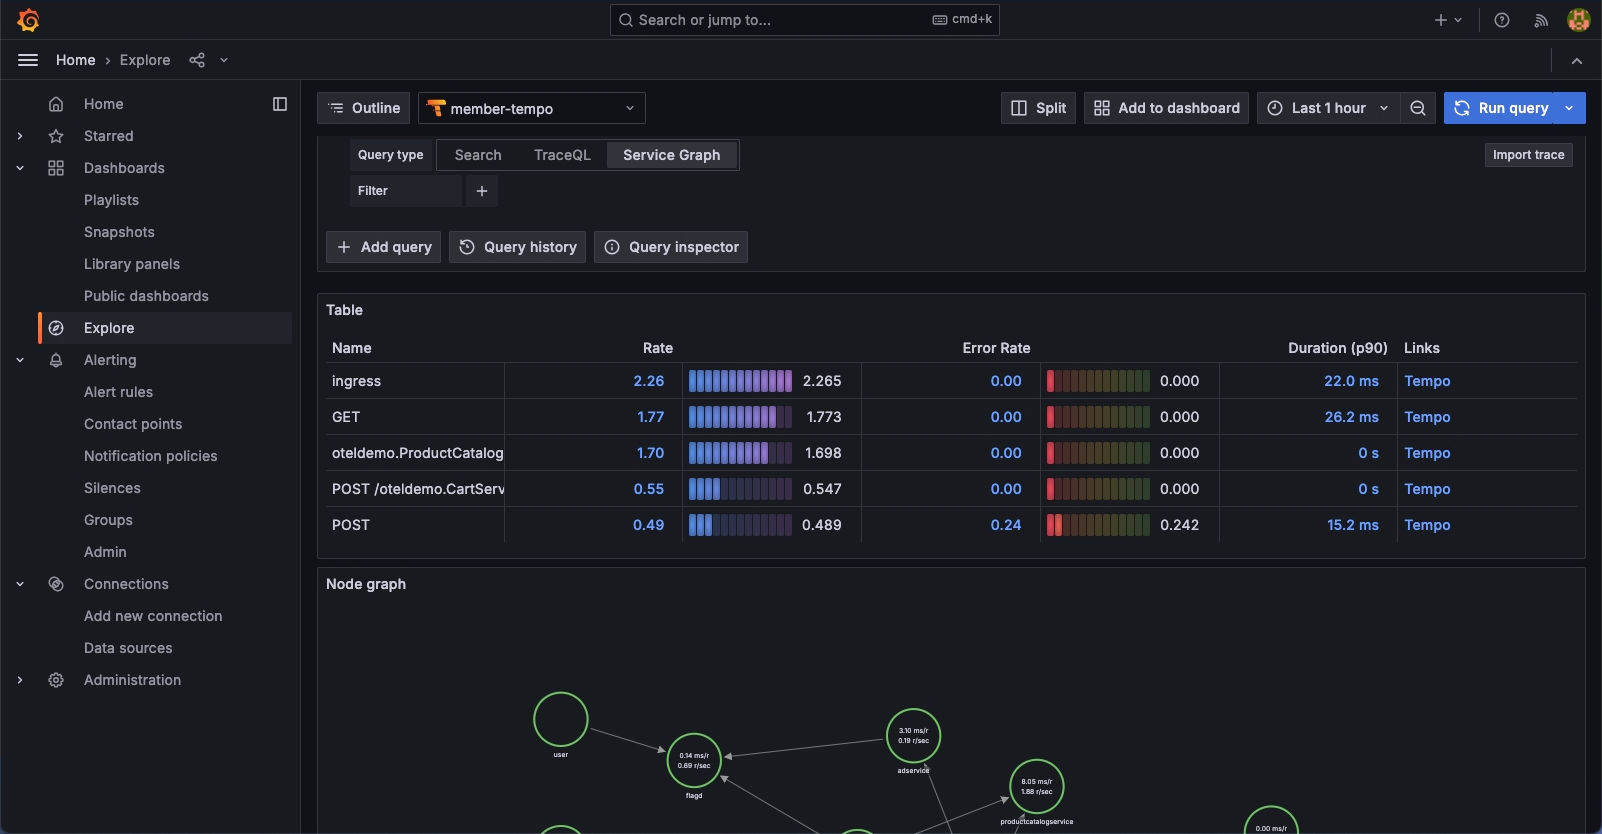
Note For more information about Tempo, please refer to the Grafana Tempo official documentation.