Visualizing Data in Loki
This section describes how to visualize KubeSphere logs, auditing, events, and notification history data stored in Loki in the Grafana console.
Prerequisites
-
The WizTelemetry Platform Service extension must be installed and enabled on the KubeSphere platform.
-
A Grafana console has been deployed via the Grafana for WizTelemetry extension or by other methods.
Steps
-
Install the Grafana Loki for WizTelemetry extension.
-
On the Application Workloads > Services page of the cluster, find
loki-agent-gateway, Edit External Access, and enable NodePort.Note Depending on your network environment, you may need to configure traffic forwarding rules and allow this NodePort in the firewall.
-
Install the WizTelemetry Data Pipeline and configure Loki information.
  sinks:
    loki:
        endpoint: http://<loki-gateway-ip>:<loki-gateway-port>
Example:
sinks: loki: endpoint: http://172.31.19.250:30858 -
Install WizTelemetry Logging, Auditing, Events, and Notification (install as needed), modify the extension configuration, and enable Loki.
sinks: loki: enabled: true -
Configure the Loki data source in the Grafana console.
-
If the Grafana console is deployed by the Grafana for WizTelemetry extension, after Grafana Loki for WizTelemetry is installed, Loki data sources for logs, auditing, events, and notification history will be automatically added to the Grafana console. For information on how to access the Grafana console, please refer to Grafana for WizTelemetry.
-
If the Grafana console is deployed using other methods, you need to manually add the Loki data source in the Grafana console. For more information, please refer to the description on the details page of the Grafana Loki for WizTelemetry extension in the Extensions Center.
-
-
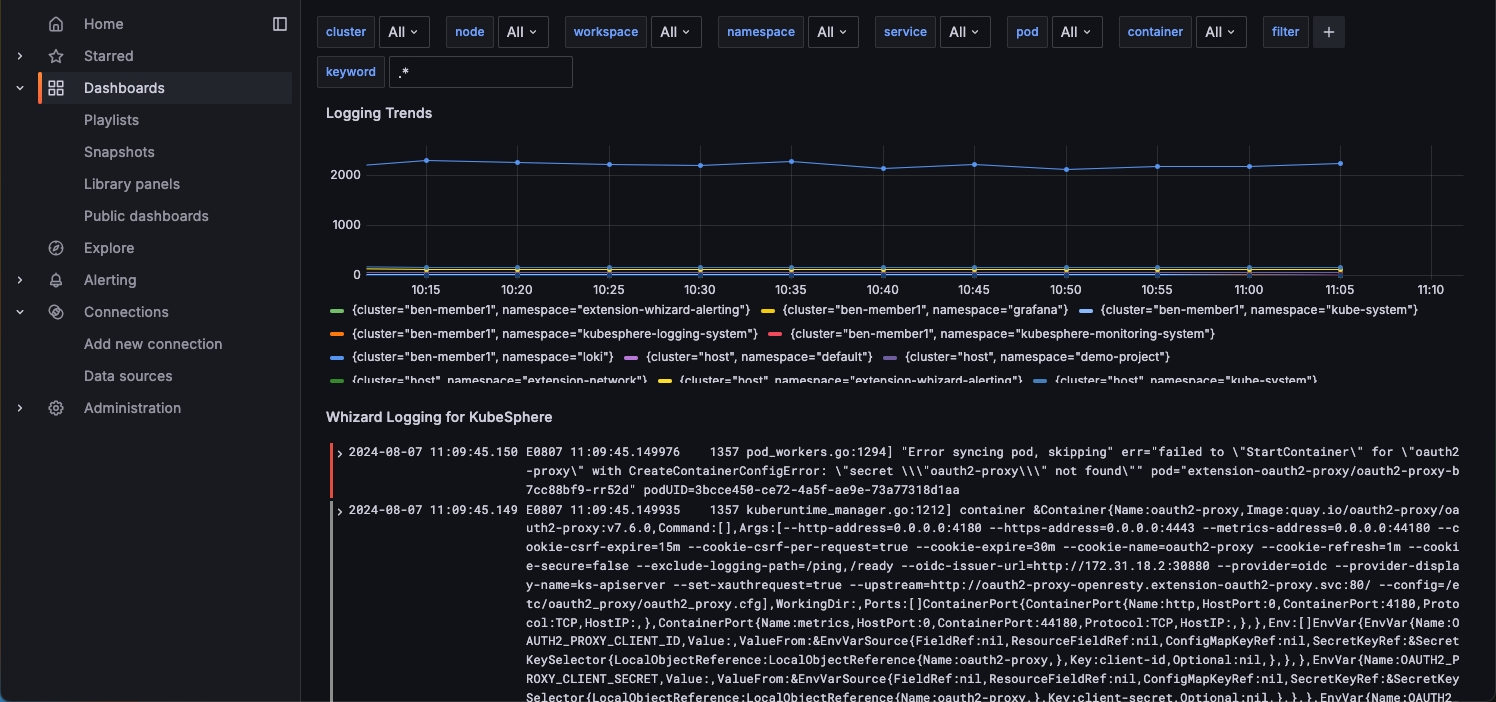
Access the Grafana console, and you can view the data dashboards for KubeSphere logs, auditing, events, and notification history under Dashboards.
Note For more information about Loki, please refer to the Grafana Loki official documentation.