Create Dashboard
After adding a data source, create a Dashboard to visualize the data from the data source.
A Dashboard consists of one or more Panels, organized and arranged in rows. Panels display visualizations and provide various control options.
This section briefly introduces how to create a Dashboard. For more information, please refer to Grafana dashboards.
Steps
-
In the Grafana console, click Dashboards in the left navigation pane.
-
Click New > New Dashboard.
-
On the blank Dashboard page, click + Add visualization.
-
In the pop-up dialog box, select the added data source. The Panel editing page will open automatically.
-
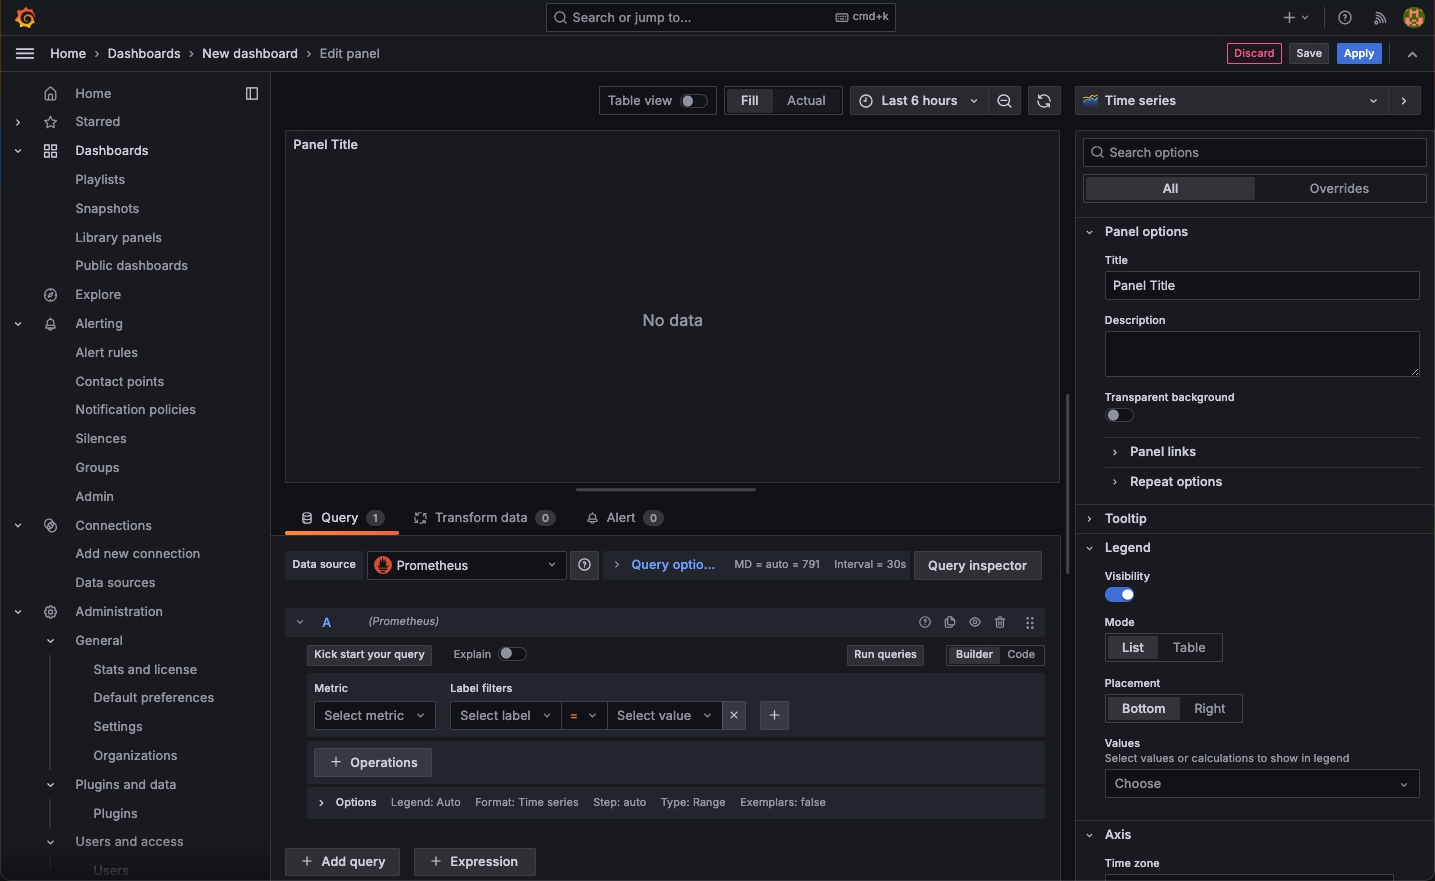
Set the query conditions using the query language of the data source.
-
Click
 to query the data.
 -
Click the chart type (e.g., Time series) on the right to select a chart style. The data will be displayed in that style.
-
In the Panel options area, set the Panel name, description, etc.
-
After editing, click Apply to save the Panel, and click Save to save the Dashboard.
When saving the Dashboard, you can set the Dashboard name, description, and the folder it belongs to.
-
-
On the newly created Dashboard page, click Add at the top, select Visualization to continue adding Panels.
-
After exiting the Panel editing page, you can drag the Panel title to move it to any position; drag the mouse at the bottom right corner of the Panel to adjust the size of the Panel in the Dashboard.
-
Click the save button at the top of the Dashboard page to save the Dashboard again.
At this point, a Dashboard containing multiple Panels is created.