Add Data Sources
This section briefly describes how to add, configure, and query data sources. For more information, please refer to Grafana data sources.
Before creating a Dashboard, you must first add a data source. The Grafana for WizTelemetry extension automatically adds the Prometheus server address as a data source by default. You can also add your own data sources, such as Loki, Elasticsearch, InfluxDB, PostgreSQL, MySQL, etc.
After adding a data source, you can:
-
Query data using Explore.
-
Visualize data in panels.
-
Create alerting rules.
Prerequisites
Only users with the admin role in the Grafana console can add or delete data sources.
Add a Data Source
-
After logging into the Grafana console, click Connections in the left navigation pane.
-
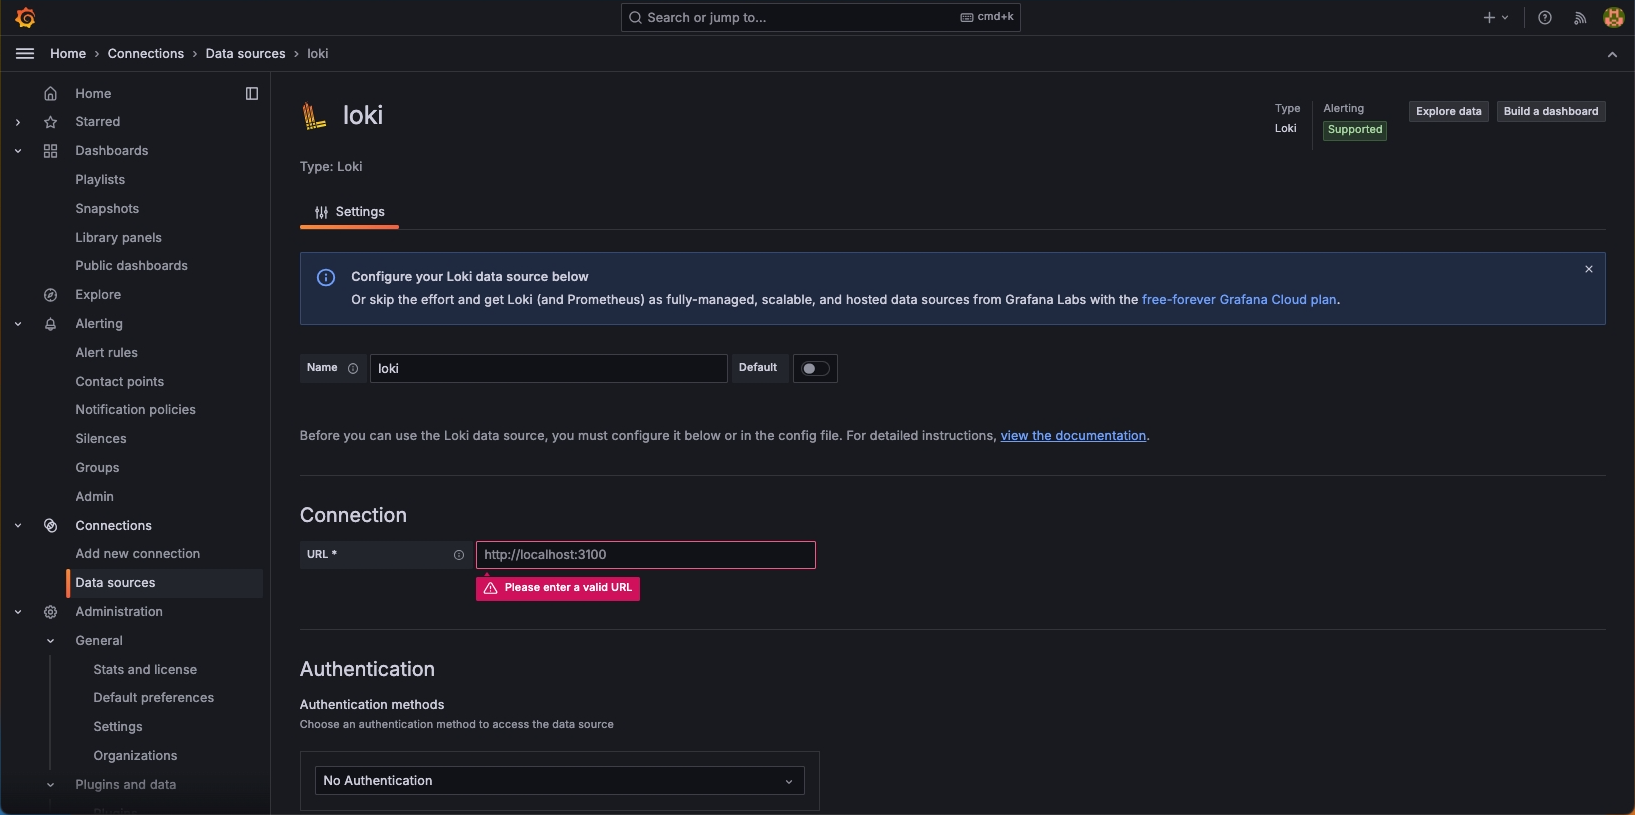
Search for a data source, such as loki.
-
Click the data source name to enter the data source overview page.
-
Click Add new data source in the upper right corner to enter the data source configuration page.
-
Enter the server address of the data source and click Save & test at the bottom to complete the addition and configuration of the data source.
Query Data Source Data
Set query conditions to retrieve data for specific metrics within a time range from the data source.
-
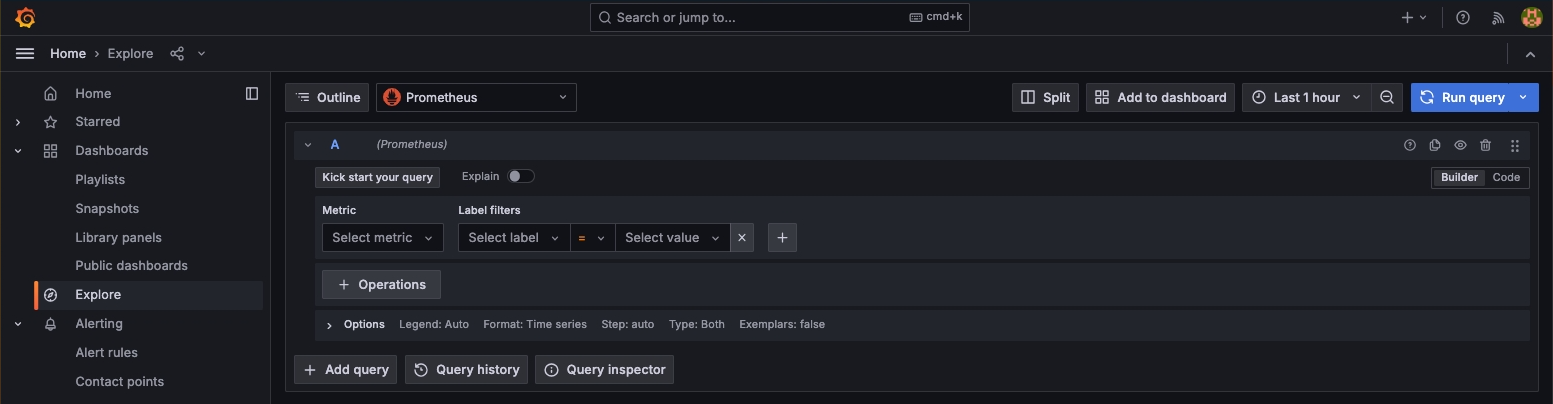
Click Explore in the left navigation pane and select the data source at the top.
-
In the query editor, enter or select a Metric, set Label filters, and then click Run query in the upper right corner.
Delete a Data Source
-
Click Connections > Data sources in the left navigation pane.
-
Click the name of the data source you want to delete to enter the data source configuration page.
-
Click Delete at the bottom to delete the data source.