View Built-in Dashboards
The Grafana for WizTelemetry extension includes multiple built-in Grafana Dashboard templates. These allow you to directly query monitoring data for Kubernetes and KubeSphere without needing to configure Grafana Dashboards yourself.
Steps
-
After logging into the Grafana console, click Dashboards in the left navigation pane to view all built-in Dashboard templates. This includes directories such as kube-prometheus-stack, whizard-loki, whizard-monitoring, etc.
Directory Template Description kube-prometheus-stack
Visualizes Kubernetes monitoring data.
whizard-loki
Visualizes KubeSphere logs, audits, events, and notification history stored in Loki.
whizard-monitoring
Multi-cluster monitoring adapted for Whizard and KubeSphere.
Note -
The Dashboards in the kube-prometheus-stack and whizard-monitoring directories will only display monitoring data after the WizTelemetry Monitoring extension is installed.
-
To have the Dashboards in whizard-loki display monitoring data, please refer to Grafana Loki for WizTelemetry.
-
-
Click on a Dashboard template within a directory to view the monitoring data for the corresponding metrics.
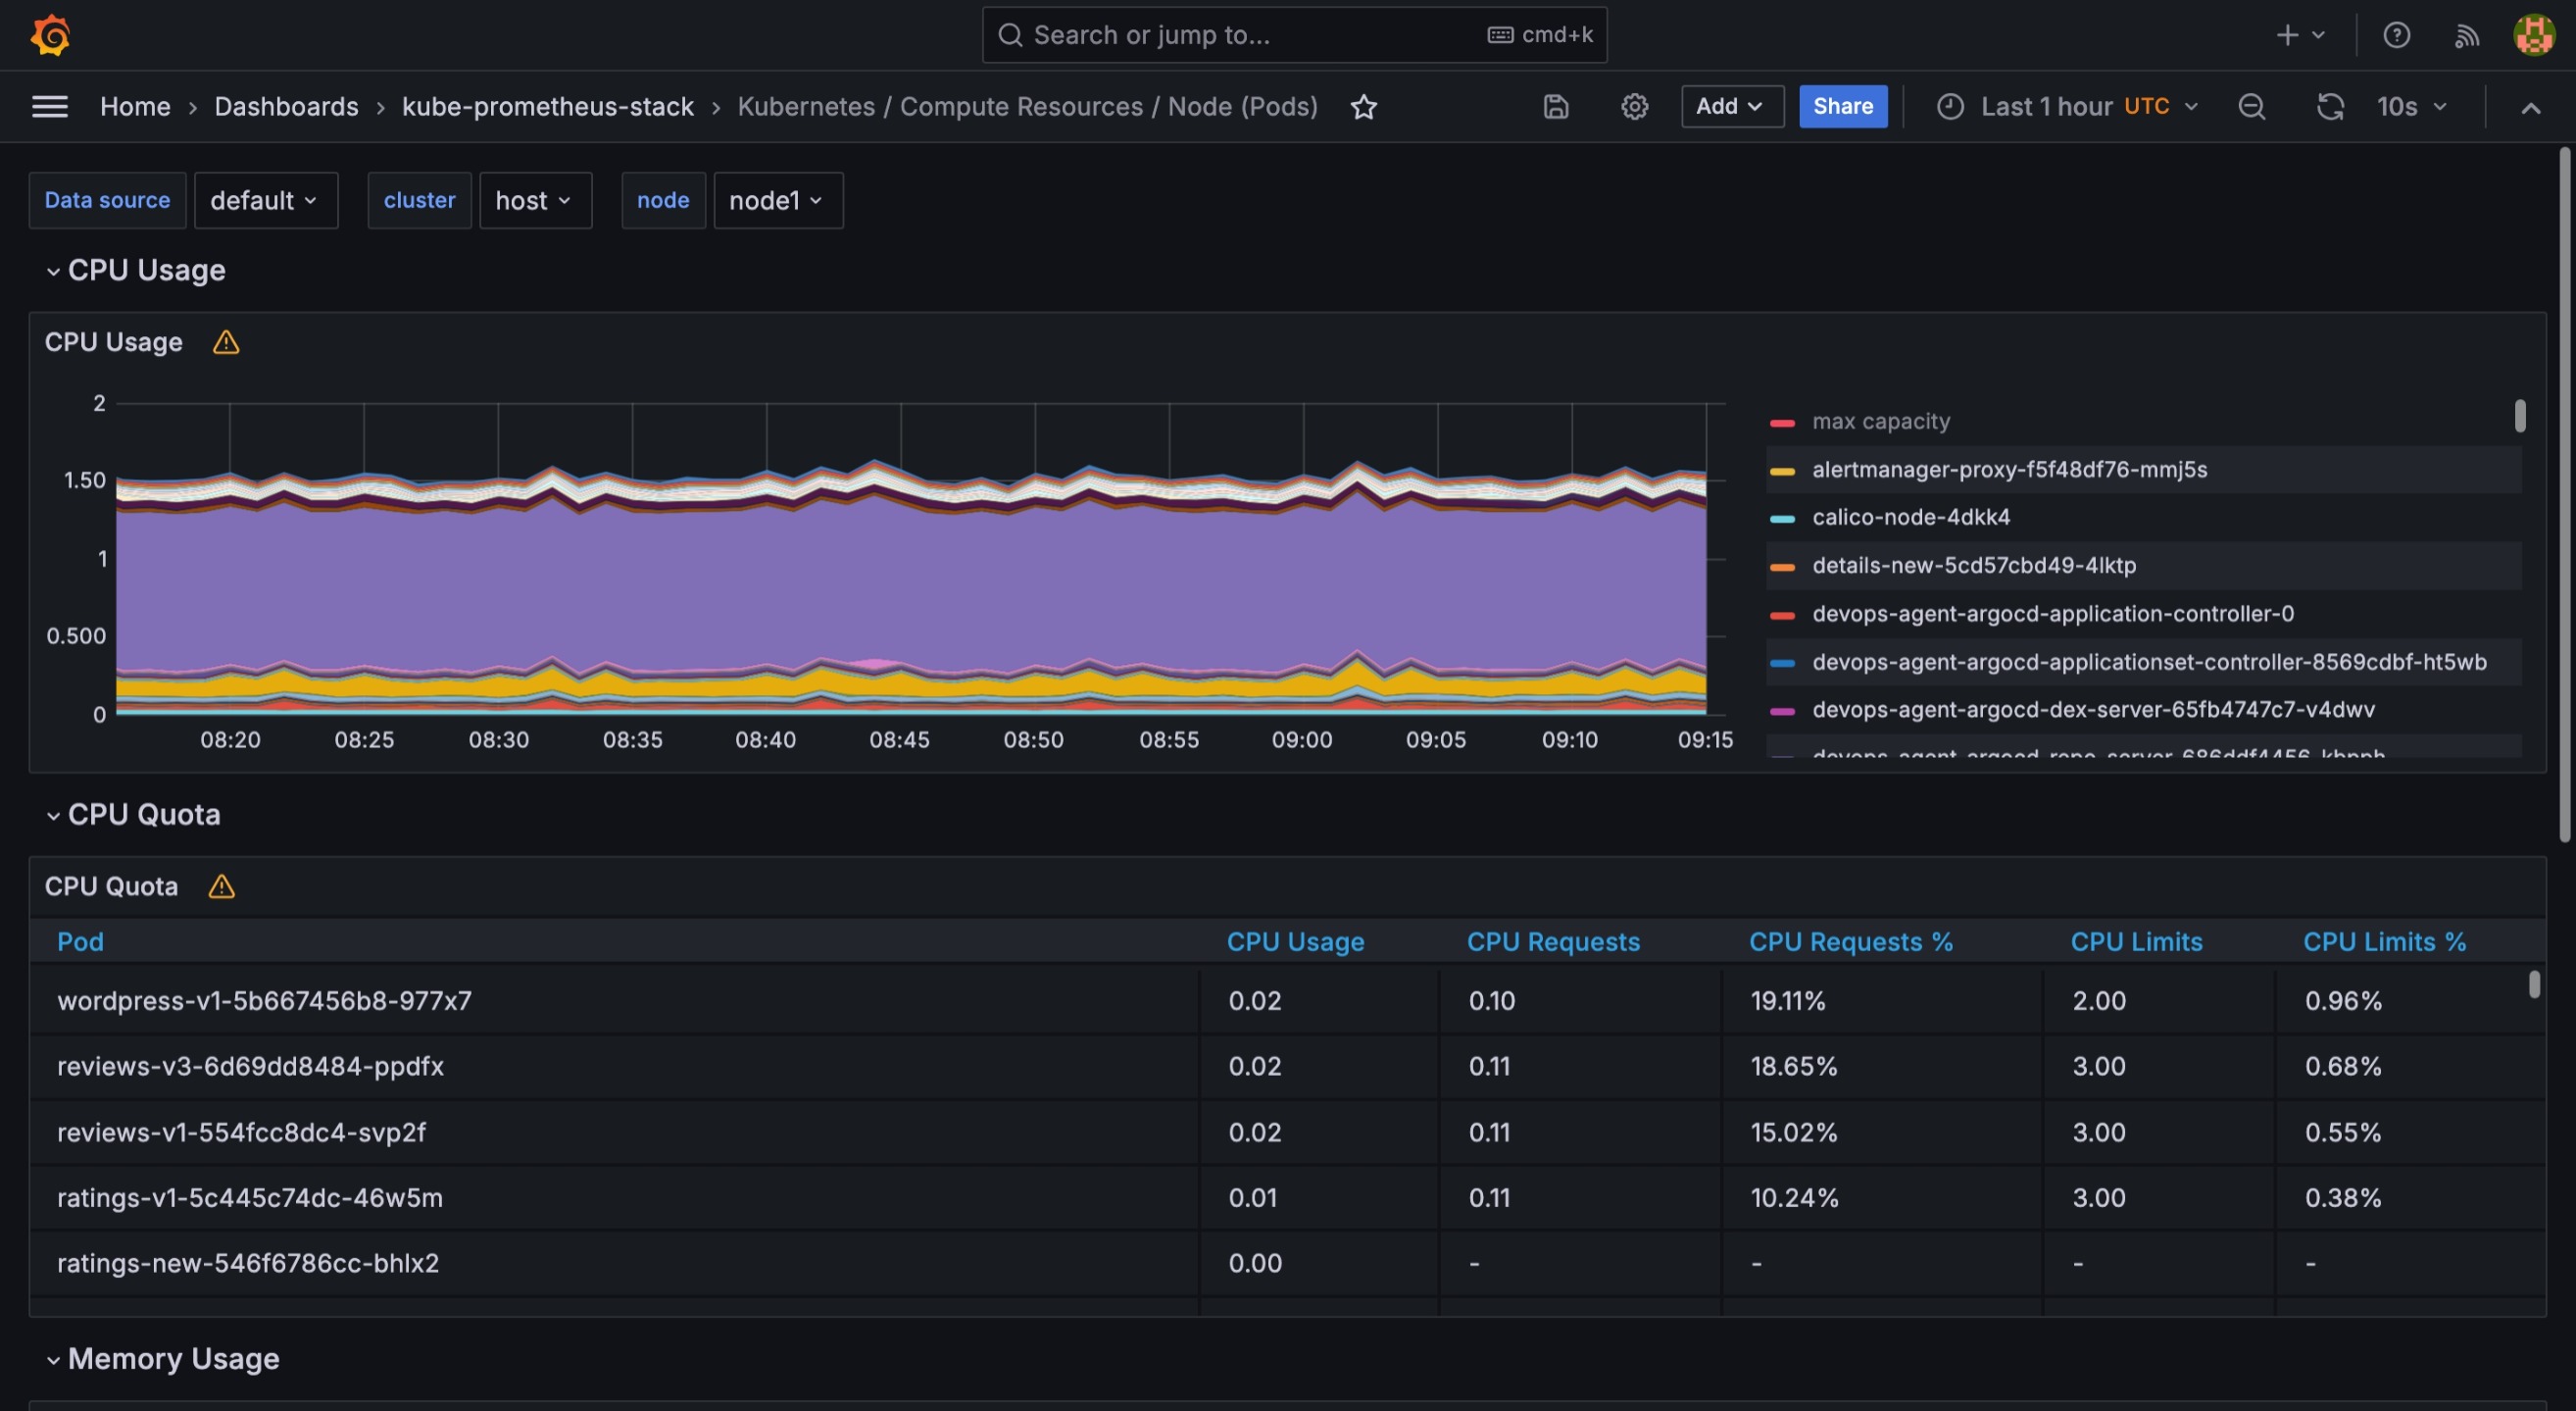
-
Click on data source, cluster, or node at the top to select and view data related to a specific data source, cluster, or node.
-
Click the
 icon in the top right corner to set the time range for data display, supporting custom time periods.
 -
Click the
 icon in the top right corner to refresh the data on the dashboard. Click
  to set the automatic refresh interval for the data.
 -
Click the
 icon in the top right corner of each Panel to perform independent operations on that specific Panel, such as viewing, editing, sharing, inspecting, or deleting.
Info For more information about Dashboards, please refer to the Grafana official documentation.